Infographics are one of the most popular content strategies to catch your audience’s attention. Their visual appeal lets people share and communicate your brand to a large number of prospects. Did you know that people really prefer 75 percent of their communication as visual forms?
Today’s fast-paced world lets people respond better to visual content than to read a whole length of texts. That’s why; infographics are fast becoming a favored component of content marketing.
Businesses create infographics almost every day. So, how to make one that stands out from the competition?
Simple Examples
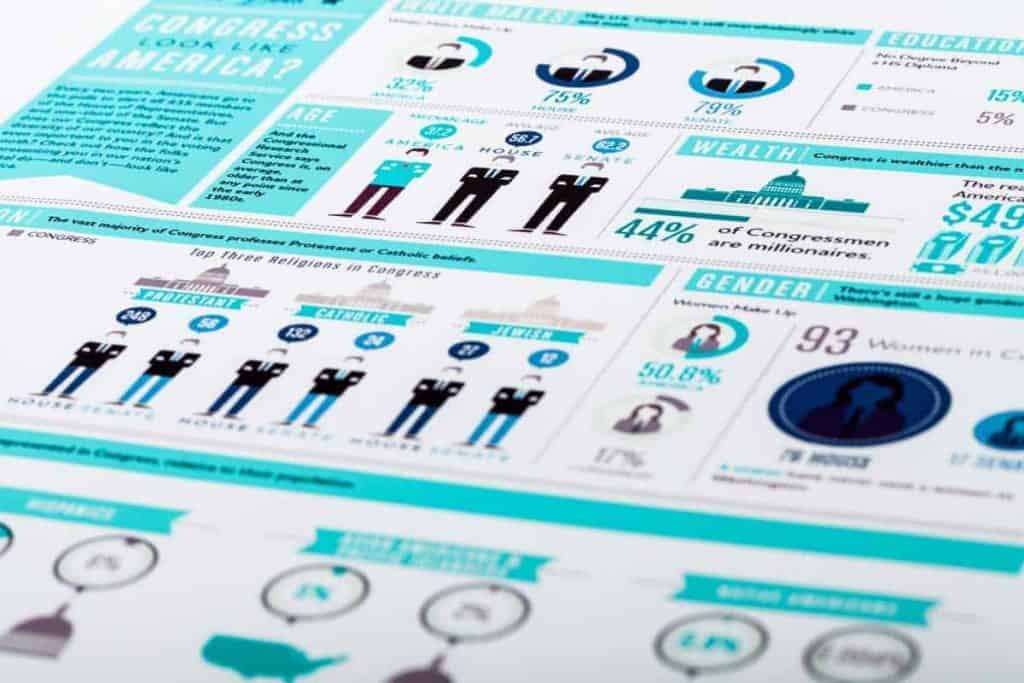
The following below are examples of infographics website owners can do for their content. For starters, you can go with flat vectors and illustrations to highlight your point. Then, onward, you can experiment and grow your infographic styles.
Steps in creating an infographics
Are you working alone or with a graphic designer? Even so, learn the steps to creating an awesome infographic that your prospects can’t resist sharing!
Understand your brand
Are you more into professionals or to the young’uns crowd? Is your brand more formal or fun to engage it? Understanding your brand can help you create a topic or a theme for your post. Not to mention, you get to pinpoint your design elements as well.
Choose a topic and ideate
Choose one topic to discuss and make it short and straight to the point. That way, your readers won’t find it too confusing to read all of your info. Even if there are other infographics being covered by your theme, brainstorm on how you can modify or add value to it as well.
Plan, write, and layout
You need to make a skeleton layout of your content to make a compelling story from the beginning to the end. Structure the piece together that link your facts, figures, and visuals together in a logical matter.
Choose your graphics and design elements. Will you be using photos or illustrations? Images make up a great deal on your infographics.
Select your typeface
Fonts can make or break your infographics. These typefaces can add a spice of your personality and brand imaging. The wrong fonts can destroy that, as well as the readability of your content. As much as possible, just use two font types. Three different font types can already be an eyesore.
Develop a marketing plan
How can people see and engage with your content? You need to find the perfect channels where you can share your work. How about a through a blog or your social channels, Facebook and Pinterest? Make it shareable so that your audience can spread your infographics.
Analyze its results
Make sure your infographics was launched with a bang. Now try to measure the outcomes of your objectives whether your infographic has met your marketing goals or not after the campaign. Have you increased sales? Or gathered enough leads?
This step-and-step guide will help you create a sound and logical infographics that can awestruck your prospects! Need more tips though?
Tips to get your infographics done
How to avoid an infographic disaster? Everyone’s making infographics nowadays to get their audience’s attention. How to get yours for people to notice better?
1. KISS it. When we say KISS, we mean – keep it simple! You don’t need to overcrowd your infographics with figures, typography, or insane images. It can be a total eyesore, and not mention, boring.
2. Focus on one idea only. For example, don’t make an infographic of all things health! Just focus on what particular health niche you would be doing. For example, an infographic on the benefits of apple, what causes mental stress, or how to prevent bone injuries.
3. Know your length and size. A sensible length and size can draw the attention of people. But, if it’s too big, you’ll start losing them too. What’s the necessary size and length limitation? A max of 8,000 pixels is already enough and a size of 1.5 MB as well.
4. Create an awesome headline. The headline is the first thing a customer notices while the graphics are the reasons why they can hold the audience’s attention. The headlines must be able to describe the infographics, but short enough to understand at a glance.
5. Check facts and cite sources. Infographics rely on data. If you want to be accurate, make sure the statistics are true and that your sources are reliable. Ensuring your facts and sources can boost your credibility and trustworthiness to the consumers.
Infographics are pretty alive and well in the digital marketing world. If you want to make an infographic, keep these handy tips in mind, and spare yourself from the blunders and challenges of making with one.